iOS 26 - Reversing Swift Like a Pro

Swift is fast, modern, and... a total pain to reverse compared to old-school Objective-C. This article breaks down the essentials of reversing Swift and shows you the tools and tricks to survive—all demoed on iOS 26.
Lately, Apple's been on a mission to swap out tons of iOS's core components from Objective-C to Swift, and honestly, it makes sense. Swift is way more modern and performant. But for us reverse engineers, it's a headache. Most of our tools still struggle to make sense of it (to say the least).
In this piece, I'll dive into the key tricks for reversing Swift, spotlight some essential utilities, and walk you through a hands-on demo on iOS 26. Buckle up.
Our Target: iOS 26's Visual Intelligence
iOS 26 introduced plenty of interesting new features. For this article, I'll be focusing on Apple's Visual Intelligence feature.
In brief, Visual Intelligence introduces Onscreen Awareness (iPhone 15 Pro/16 required), letting you analyze screenshots. You can highlight any item to search for it, or tap a poster in a screenshot to instantly create a calendar event, with new integrations for Google and ChatGPT.
🛠️ Environment Setup
Downloading the iOS 26 IPSW
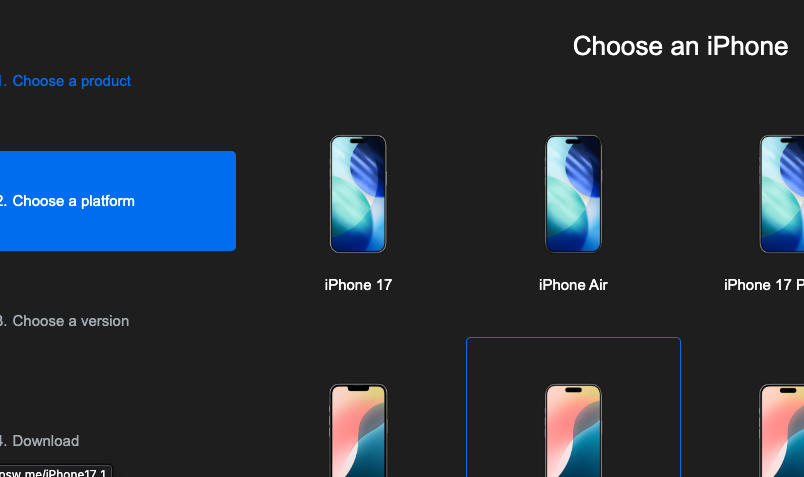
You can find all released iOS versions for any Apple device ready for download at ipsw.me. (IPSW = iPhone Software).
Simply choose iOS version -> choose a device -> download.
Locating the Relevant Files
My go-to tool for spotting new features and binaries in an iOS release is ipsw-diff. It shows all the new dylibs, kernel extensions, Mach-Os, and more.
In the DSC (Dyld Shared Cache) section for this update, we can see a few new files:
/System/Library/Frameworks/VisualIntelligence.framework/VisualIntelligence/System/Library/PrivateFrameworks/VisualIntelligenceCore.framework/VisualIntelligenceCore/System/Library/PrivateFrameworks/VisualIntelligenceCoreDDSupport.framework/VisualIntelligenceCoreDDSupport/System/Library/PrivateFrameworks/VisualIntelligenceUI.framework/VisualIntelligenceUI
We'll focus on the first one: VisualIntelligence.
Extracting the VisualIntelligence Framework
For this, I used ipsw-parser, a utility that parses an IPSW into a convenient file hierarchy.
Decompiling VisualIntelligence
To view the decompiled code, you have two main options:
- Open the
VisualIntelligencebinary directly (the one extracted byipsw-parser). - Open the entire dyld_shared_cache.dylib in IDA and select the
VisualIntelligenceframework from there.
I highly recommend the second option. Frameworks within the DSC call one another constantly. If you load the full DSC, IDA's built-in plugin lets you just jump between them on demand. If you load the binary by itself, all those cross-framework calls will be unresolved.
After running ipsw-parser, you'll find the dyld_shared_cache here:
1./private/preboot/Cryptexes/OS/System/Library/Caches/com.apple.dyld/dyld_shared_cache_arm64e
Opening this file in IDA will immediately show you exactly what I meant about Swift being harsh on reverse engineers:
🤯 Swift Pain Points
Unfortunately, it doesn't take long to see where decompilers like IDA struggle with Swift. Here's an example function I selected from the VisualIntelligence framework: VisualLookupClassifier.Result.init.
As the name suggests, it probably initializes a classification result from the visual lookup. Let's look at the decompilation and highlight the issues.
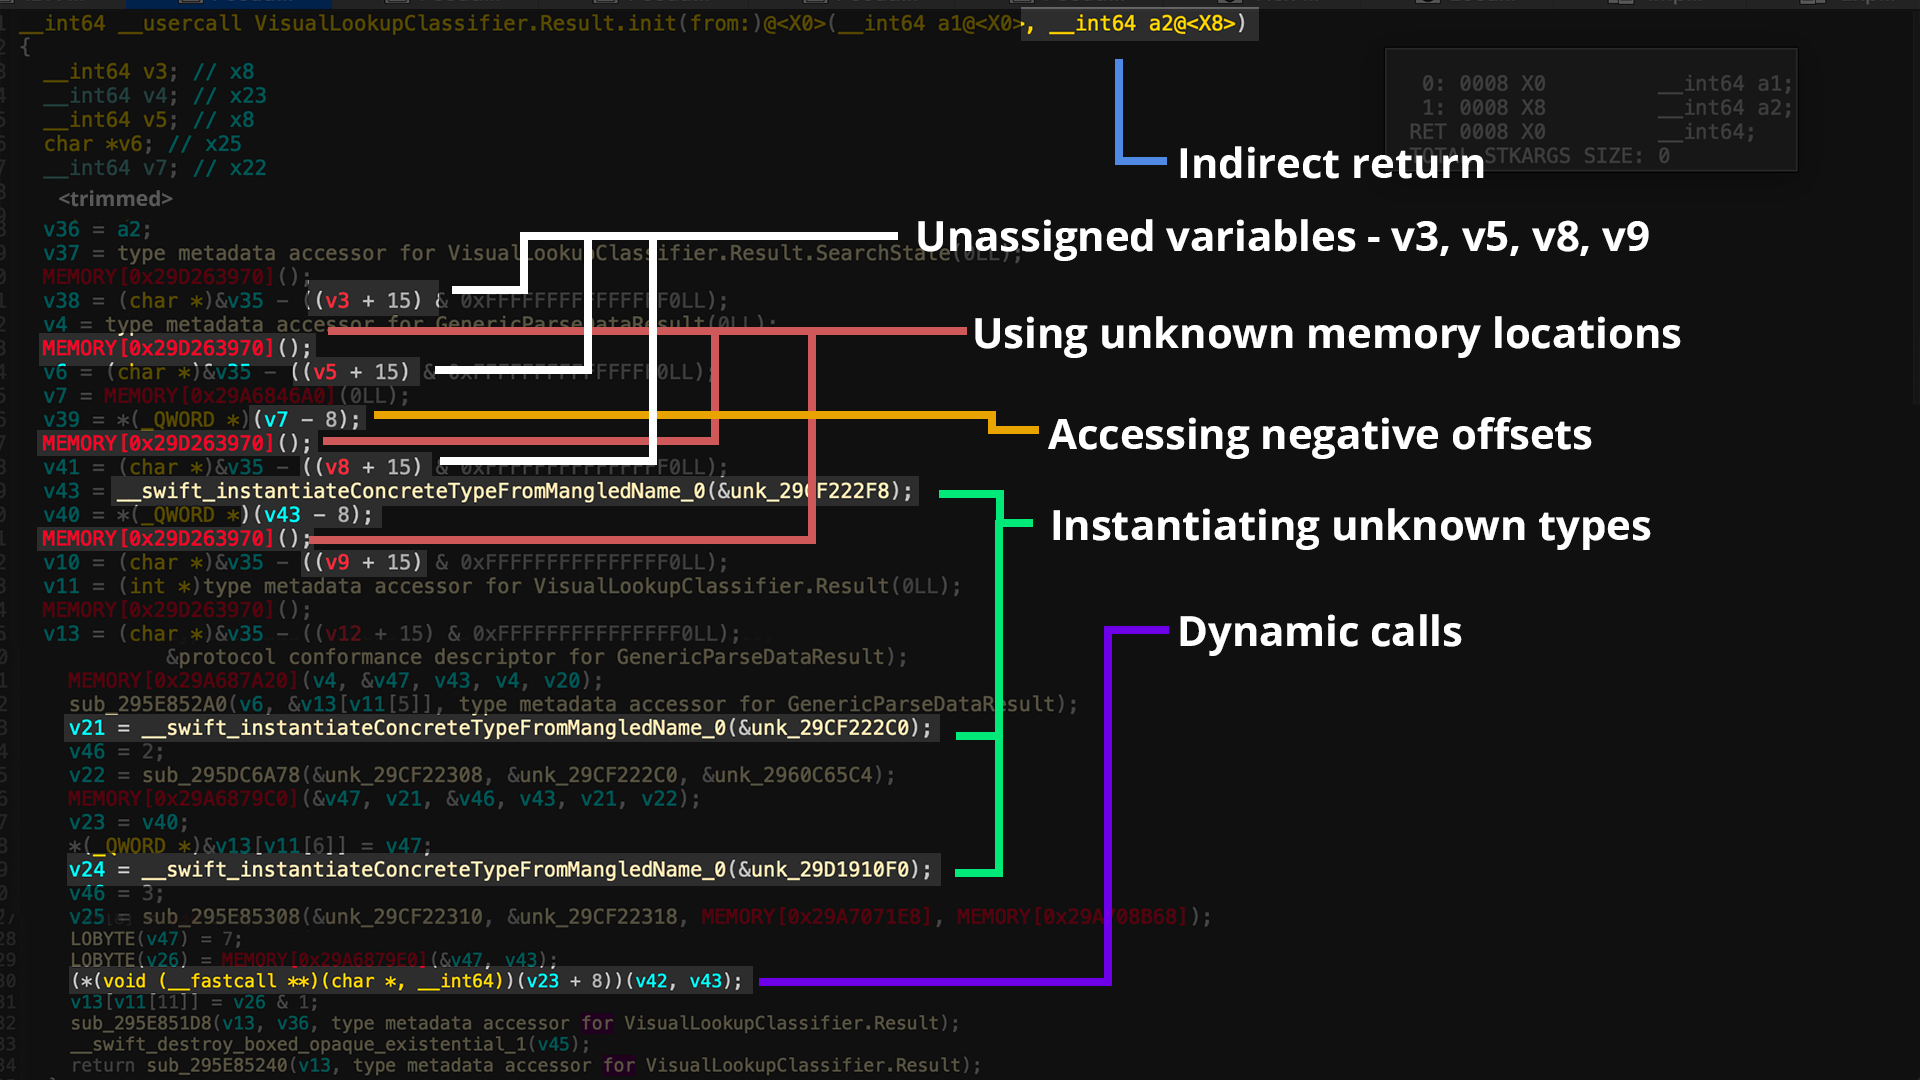
These problems are extremely common and show up in almost every function. Let's dig into why they happen and how to fix them.
1. Accessing Unknown Memory Locations
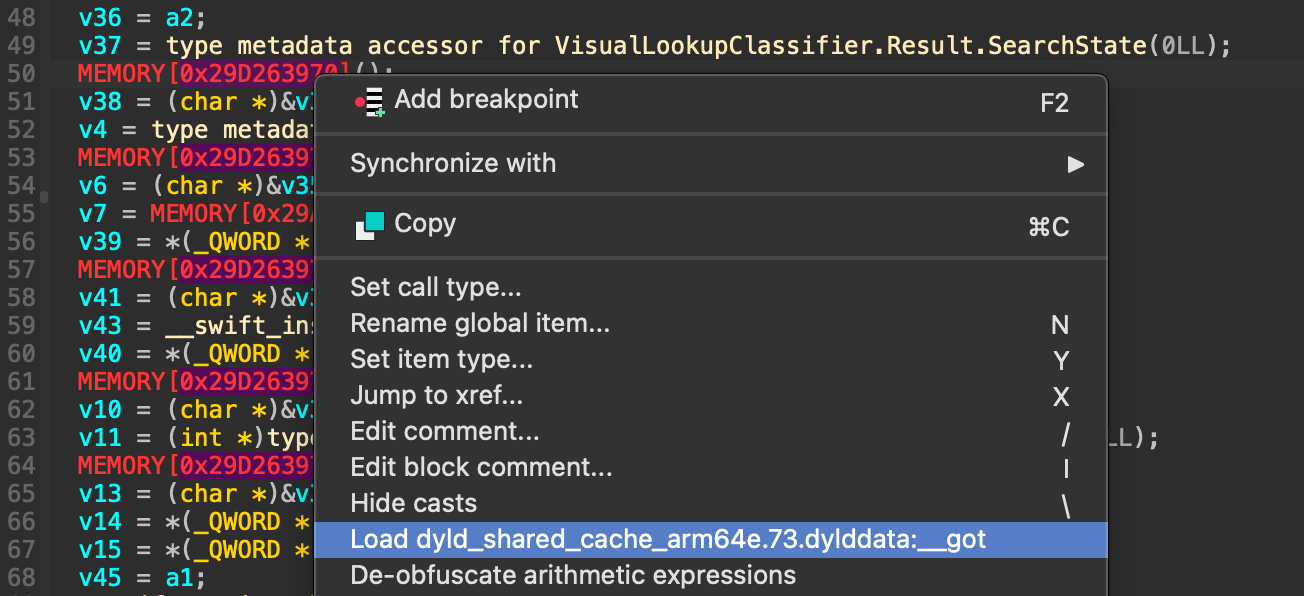
While reversing Swift binaries, especially in the DSC, you'll constantly run into unknown memory locations. This happens because, as I mentioned, DSC frameworks call one another. Since IDA's plugin loads them individually, some addresses for other frameworks aren't loaded, so IDA can't resolve them.
To fix this, you can right-click on the memory address and load the relevant segment.
2. Indirect Returns
Look at the function signature. The a2 parameter is mapped to register x8.
1__int64 __usercall VisualLookupClassifier.Result.init(from:)@<X0>(__int64 a1@<X0>, __int64 a2@<X8>)2{3 // Code here4}
This is a classic indirect return, sometimes called sret (structure return). It means the function doesn’t place its return value in a register (like X0). Instead, the caller allocates space for the result and passes a hidden "out" pointer to that space.
On arm64, the Swift ABI typically passes this 'out' pointer in X8 (which is what IDA shows as a2@<X8>). The callee (this function) writes its result into that buffer. You'll see stores to [x8] in the assembly instead of a normal register return. This pattern is used for large types (big structs/tuples) or generic types that are too big to be returned directly in registers.
Simple Swift Example:
1// Direct return: small type fits in a register -> returned in X02func add(_ a: Int, _ b: Int) -> Int { a + b } // direct return (X0)34// Indirect return: large aggregate -> caller provides out-buffer in X85struct Big { var a: Int, b: Int, c: Int, d: Int }6func makeBig() -> Big { Big(a: 1, b: 2, c: 3, d: 4) } // indirect return (out-pointer in X8)
Tying this back to our decompilation: the parameter a2@<X8> is that hidden 'out' pointer. When reversing, track all writes to [x8] to reconstruct the fields of the returned value.
3. "Undefined" Variables (Calling Convention Chaos)
One of the most annoying things when looking at decompiled Swift is seeing variables painted red—used without any apparent assignment. This often creates flawed or nonsensical logic.
Rule of Thumb: When the decompiled code makes zero sense, look at the assembly. The assembly is the source of truth.
These "undefined variable" gaps are very commonly caused by the decompiler misunderstanding the function's calling convention (ABI). This happens all the time with Swift's patterns:
- Functions with indirect returns (like the one above).
- Minimal stub/thunk functions that just forward arguments.
- Swift runtime glue functions (like
swift_allocBox,swift_retain, etc.) where arguments and returns are passed in specific ways.
When the decompiler assumes the wrong ABI, it might incorrectly mark a live register as "clobbered" (overwritten) or miss a return value, leading to red, "undefined" variables.
The fix is to manually correct the function’s calling convention and spoiled registers.
Pro Tip: A common culprit is thread_chkstk_darwin_ptr. In IDA, press "Y" on the function name or call site to edit its type, and set it to:
1void (__usercall __spoils<> *thread_chkstk_darwin_ptr)()
This tells IDA: "This is a user-defined calling convention, and this function does not spoil any registers relevant to the caller." This simple change prevents the decompiler from treating live registers as undefined after the call, cleaning up the code immensely.
General Guidance:
- For functions like
swift_allocBoxor metadata accessors, check the official Swift repo on GitHub to see the real implementation and ABI. Adjust the prototype in IDA to match. -
__usercalllets you bind arguments/returns to specific registers. __spoils<>declares which registers the callee clobbers.
Correctly modeling these will remove most of the false "undefined variable" warnings and give you much cleaner code. For more, read the IDA docs on custom calling conventions.
-8 Offset: Witness Tables
You will *frequently* see loads and stores like [xN, #-8] in Swift decompilations. What is this?
That slot at -8 is almost always the object's witness table pointer.
You will also often see -16 used to read the type metadata pointer. Together, these pointers tell the runtime how to operate on a value generically.
What is a Witness Table?
It's a compiler-generated list of function pointers. It exists for a specific protocol conformance (e.g., when MyStruct conforms to Codable). Generic code uses this table to call the correct function (like encode(to:)) without knowing the concrete type (MyStruct) at compile time.
What is a ValueWitnessTable (VWT)?
This is a specific kind of witness table, attached to all type metadata, that defines basic value operations: how to initialize, destroy, copy, or move the value. Swift's generics rely on the VWT to manage values in a type-agnostic way.
Here's what to do:
When you see a load from [x?, #-8] followed by an indirect call, you're looking at a call through a witness table—very often the VWT.
You can model this in IDA to clean up the decompilation. Define the ValueWitnessTable struct in "Local Types" and apply it to pointers you identify.
1struct __attribute__((packed)) ValueWitnessTable2{3 void *(__usercall *initialize_buffer_with_copy_of_buffer)@<X0>(void *dest@<X0>, void *src@<X1>, *self@<X2>);4 void (__usercall *destroy)(void *object@<X0>, *self@<X1>);5 void *(__usercall *initialize_with_copy)@<X0>(void *dest@<X0>, void *src@<X1>, *self@<X2>);6 void *(__usercall *assign_with_copy)@<X0>(void *dest@<X0>, void *src@<X1>, *self@<X2>);7 void *(__usercall *initialize_with_take)@<X0>(void *dest@<X0>, void *src@<X1>, *self@<X2>);8 void *(__usercall *assign_with_take)@<X0>(void *dest@<X0>, void *src@<X1>, *self@<X2>);9 unsigned __int64 (__usercall *get_enum_tag_single_payload)@<X0>(void *enum_@<X0>, unsigned __int64 emptyCases@<X1>, *type@<X2>);10 void (__usercall *store_enum_tag_single_payload)(void *enum_@<X0>, unsigned __int64 whichCase@<X1>, unsigned __int64 emptyCases@<X2>, *type_metadata@<X3>);11 unsigned __int64 size;12 unsigned __int64 stride;13 unsigned __int32 flags;14 unsigned __int32 extra_inhabitant_count;15};
Once this struct is applied, those mysterious indirect calls will become readable calls like vwt->destroy(...).
5. Dynamic Function Calls
Dynamic (indirect) calls pop up everywhere in Swift. This happens whenever the target function is selected at runtime, not compile time. This is the core mechanism for:
- Generics and protocols (dispatching through witness tables)
- Value operations (dispatching through the VWT)
- ObjC bridging (
objc_msgSend)
In IDA, these look like calls through a pointer, often loaded from a negative offset (like the VWT at [x?, #-8]).
Common VWT Pattern:
1// ------------ Before assigning VWT ------------2// Address: 0x295E5C1403if ( !v40 )4 {5 (*(void (__fastcall **)(char *, __int64))(v54 + 8))(v21, v50);6 (*(void (__fastcall **)(char *, __int64))(v37 + 8))(v39, v11);7 goto LABEL_21;8 }9 (*(void (__fastcall **)(char *, __int64))(v37 + 8))(v39, v11);10// -----------------------------------------------1112// ------------ After assinging VWT -------------1314if ( !v40 )15{16 v54->destroy(v21, v50);17 v37->destroy(v39, v11);18 goto LABEL_21;19}20v37->destroy(v39, v11);21// ------------------------------------------------22
- What’s happening:
v54andv37are pointers to aValueWitnessTable. The code is calling the standarddestroyoperation for whatever concrete type is being used. - Make it readable: As soon as you identify a pointer as a VWT, cast it to your
ValueWitnessTable*struct. The decompiler will immediately transform the code from((void (__fastcall *)(...))v37 + 8)(...)tov37->destroy(...).
Alternatively, Set a Breakpoint
Sometimes you can't statically resolve the target. In that case, you have to debug it.
- Set a breakpoint at the indirect call site (the
BLRinstruction). - When hit, inspect the register holding the function pointer (often
x16/x17). stepi(step instruction) to jump into the concrete implementation.- Note the function's symbol/name.
- Go back to IDA and annotate the call site with the target you found.
6. 🧬 Instantiating Unknown Types
When the compiler can't bake in a concrete type (e.g., with generics), the runtime has to materialize the type's metadata on demand. It does this by calling __swift_instantiateConcreteTypeFromMangledName. The result is a pointer to the type metadata, which is then used for everything else (allocation, VWT calls, etc.).
1// WTF? Which type is created here??2v43 = __swift_instantiateConcreteTypeFromMangledName_0(&unk_29CF222F8);
What that argument really is:
The argument (which IDA often calls unk_XXXXXXXX) is not the metadata. It's a pointer to a slot in the __DATA section. This slot contains a 32-bit relative pointer (an offset) that points to a "type reference" blob in the __TEXT.__swift5_typeref segment.
The runtime reads this offset, adds it to a base address, and authenticates the resulting pointer (on arm64e) to find the symbolic reference blob. T
The __swift5_typeref segment:
This segment contains symbolic references - all look pretty similar. Each blob is a compact, encoded description of the type. It's a graph of tags and relative pointers that describe nominal types, generic arguments, and more.
0x01: Direct reference to a context type descriptor (followed by a 4-byte relative pointer).0x02: Indirect reference (same structure).0xFF: Reference to a metadata access function.
Practical Reversing Workflow:
1. At the call site, jump to the &unk_XXXXXXXX argument in the __DATAsection.
2. You'll see a DCD (a 32-bit dword). This is your relative offset.
1 VisualIntelligenceCore:__data:000000029CF222F8 dword_29CF222F8 DCD 0xF91CE5B6
3. Manually calculate the target address. This Python snippet shows how (it's a signed 32-bit offset):
1 In [4]: address = 0x29CF222F8 # Address of the dword2 In [5]: relative_pointer_value = 0xF91CE5B63 In [6]: if relative_pointer_value & 0x80000000:4 ...: offset = relative_pointer_value - 0x1000000005 ...: else:6 ...: offset = relative_pointer_value7 In [7]: hex(offset)8 Out[7]: '-0x6e31a4a'9 In [8]: target_address = address + offset10 In [9]: hex(target_address)11 Out[9]: '0x2960f08ae' # This is our target!
4. Jump to that target address (0x2960f08ae). You are now at the symbolic type reference blob in __swift5_typeref.
1 // Target address from the relative pointer:2 VisualIntelligenceCore:__swift5_typeref:00000002960F08AE _symbolic... DCB 23
5. Now you can rename the original unk_... variable in __DATA to something meaningful, like typeref_VisualLookupClassifier_Result_CodingKeys.
This makes the code instantly more readable:
1// Before resolving2v43 = __swift_instantiateConcreteTypeFromMangledName_0(&unk_29CF222F8);34// After resolving5v43 = __swift_instantiateConcreteTypeFromMangledName_0(&typeref_VisualLookupClassifier_Result_CodingKeys);
If we follow the logic of how swift runtime demangles symbolic references - we will be able to recover this type entirely!
1enum CodingKeys: String, CodingKey {2 case bundleId3 case parseData4 case location5 case searchHistory6 case searchResults7 case searchState8 case selectedVisualUnderstandingTimestamp9 case isHighResolutionStill10}
You can see the source code responsible for parsing these symbolic references here.
✅ Conclusion
Reversing Swift is an exercise in patience. As we've seen, decompilers like IDA and Ghidra do their best, but they often stumble over Swift's complex ABI, extensive use of metadata, and dynamic dispatch mechanisms. This leaves us with decompiled code that is full of "undefined" variables, un-anchored memory accesses, and mysterious indirect calls.
As a final takeaway: when reversing Swift, it is important to first gather an understanding of the common quirks of the decompiler and fix them manually before trying to unravel any logic. This means manually fixing calling conventions, defining VWT structs, and resolving relative type references. It takes a lot of practice, but once you learn to spot these patterns, you can clean up the decompilation and start to see the *actual* logic underneath.
HexAI Solution for Swift
At HexAI, we've developed powerful tools to solve all of the mentioned issues automatically, and in combination with LLMs we transform messy decompiled code into precise, readable swift source code.
If you are doing research in Swift, we encourage you to contact us.
Here’s a glimpse into iOS internals research with HexAI, a source code-like experience for closed-source binaries:
📚 References
* ipsw.me - for downloading iOS versions
* ipsw-diff - showing diff between versions of ipsw
* ipsw-parser - Parses IPSW to a convenient files hierarchy
* Swift Calling Convention - Official docs on the calling convention used by Swift
* Swift Source Code - For when you need to see the runtime implementation.